Financial statement analysis is used by many groups of people. Some of these include investors and creditors who are making investment and lending decisions. Most importantly, business owners can use them to measure the effectiveness of their operations, investments, and finances. Finally, valuation analysts use financial analysis to aid in valuing businesses. A financial statement analysis delves into the income statement, balance sheet, and cash flow statement.
Peak Business Valuation is a leading business appraiser in the United States. We value dozens of companies each month and are happy to help you understand the value of a business. Schedule a free consultation to get started.
Analyzing Financial Statements
The income statement is very useful in assessing profitability. While the balance sheet is useful to determine the financial position of the company. Lastly, the cash flow statement is useful to evaluate the business’s ability to make future investments and repay investors and lenders.
While individual numbers can tell a story, typically they are not sufficient. Often, a company is compared to companies within their industry. This benchmark can then help determine how the company is performing.
Every company is different in size and to make more accurate comparisons, financials are generally converted into percentages or ratios. By eliminating size as a factor, it enables analysts to view a better picture of how the company is performing over time. Two methods are commonly used, common-size analysis and ratio analysis.
Common Size Analysis
The process of converting financial statement data into percentages is common size analysis. This allows comparisons between companies and the analysis of patterns over time. A valuation analyst can calculate common size percentages either vertically or horizontally.
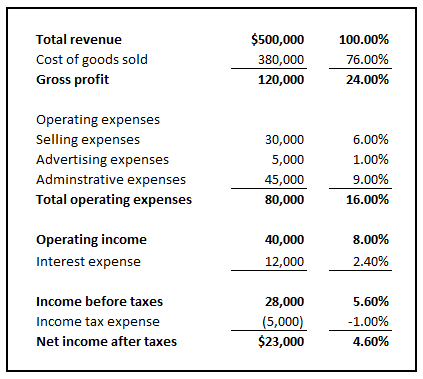
A vertical common size analysis divides all items on the income statement by the current year’s total revenue. While on the balance sheet, it divides all items by total assets. Then state the result as a percentage. An individual can then compare these percentages to previous year percentages or specified peer companies. See the following example for a common size income statement.
Horizontal common size analysis shows the percentage increases from year-to-year for each line item.
Common size analysis, both vertical and horizontal, is used to identify trends over time and/or areas that need attention.
Ratio Analysis
On the other hand, ratio analysis involves combining financial data from one or more financial statements to compute a ratio. This measures certain aspects of performance for the subject company. Ratios are often classified in groups, such as efficiency, liquidity, solvency, profitability, and market. In order to see if there is a trend, analysts look at ratios for a minimum of three years.
Efficiency Ratios
Efficiency ratios measure how well a company manages certain aspects of its operations, such as inventory and receivables. These indicate how well a company is managing its operations and the use of assets. Ratios vary from industry to industry, but the most common ratios include inventory turnover, receivables turnover, fixed asset turnover, and total asset turnover.
Liquidity Ratios
Liquidity ratios measure a company’s ability to meet its short-term obligations. These ratios measure how quickly a company can generate enough cash to fund ongoing operations and meet current obligations. Cash on hand, lines of credit and daily cash flow all show liquidity.
Solvency Ratios
Solvency ratios measure the ability to meet long-term obligations. They address the sustainability of the business’s capital structure. Debt to total capital measures the financial leverage a company has. Higher debt levels tend to imply higher risk. However, debt is typically cheaper than equity and the interest paid can be deducted from taxes. Another ratio used is times interest earned. It measures the ability of the business to pay interest on debt using current operating income.
Profitability Ratios
Profitability ratios measure how well a company uses it assets to generate profit. One can base it on sales, assets or equity. The higher the ratio the more profitable to the company. Ratios may include gross profit margin, operating margin, net margin, return on assets, and return on equity.
Market Ratios
Market ratios measure the market’s perception of a company’s value relative to its peers and the market. Analysts often use benchmark data or obtain ratios for the industry group of the subject company. They then select a small group of peer companies within the industry that closely resemble each other in terms of business mix and size.
Summary
We at Peak Business Valuation perform multiple financial statement analyses on a daily basis. A business valuation can help you understand more about your financials, receive benchmark comparisons and help you create goals to increase your profitability. We would love to help and are happy to answer any questions you may have. Please reach out by scheduling a free consultation.